General Report Usage
Each report is made up of 3 sections, Filters, Summary and Data.
There are a number of components that appear on all or most reports, but not all options appear on all reports. The function of the common components are described here.
Filters: Allow you to set ranges for the data such as dates and shops. These can be altered whilst in the report to refresh the data.
NOTE: There is currently no option to print the reports.

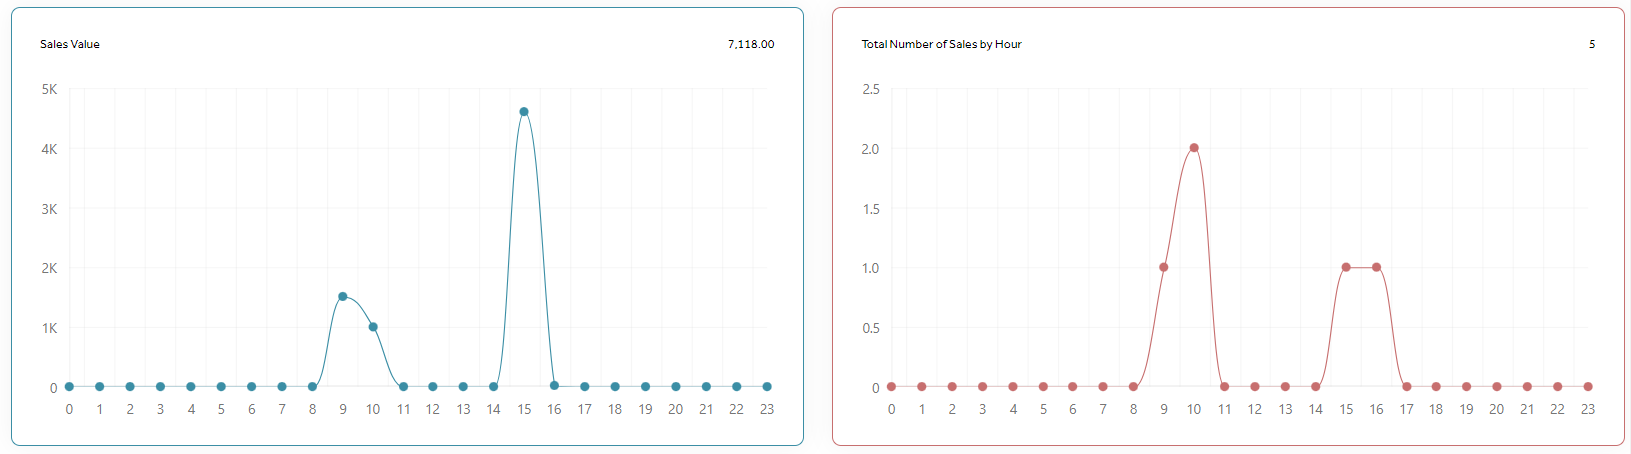
Summary: Gives you overall figures for the data. Some reports have additional summary boxes that can be swapped for the shown ones. The Summary boxes also allow for individual statistics to be shown.

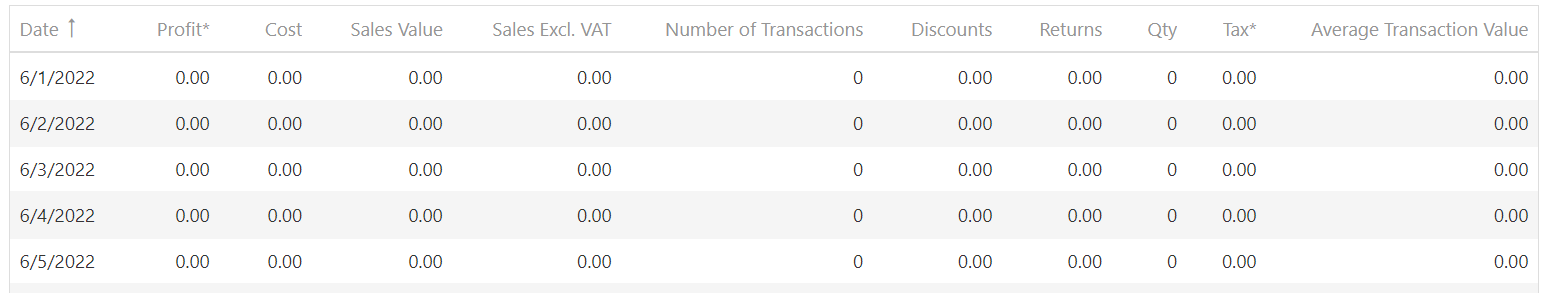
Data: Displays the data in table format or depending on the report, graph format. The look and ordering of the data in the table can be altered to suit your needs.