Dashboard
The Dashboard is an overview of how the company is performing, shown in the form of graphs and key performance figures.
From the Date Filter and Shop Selection filter you can break down the overview into specific periods of time and by individual shop.
Key Performance Figures

Graphs
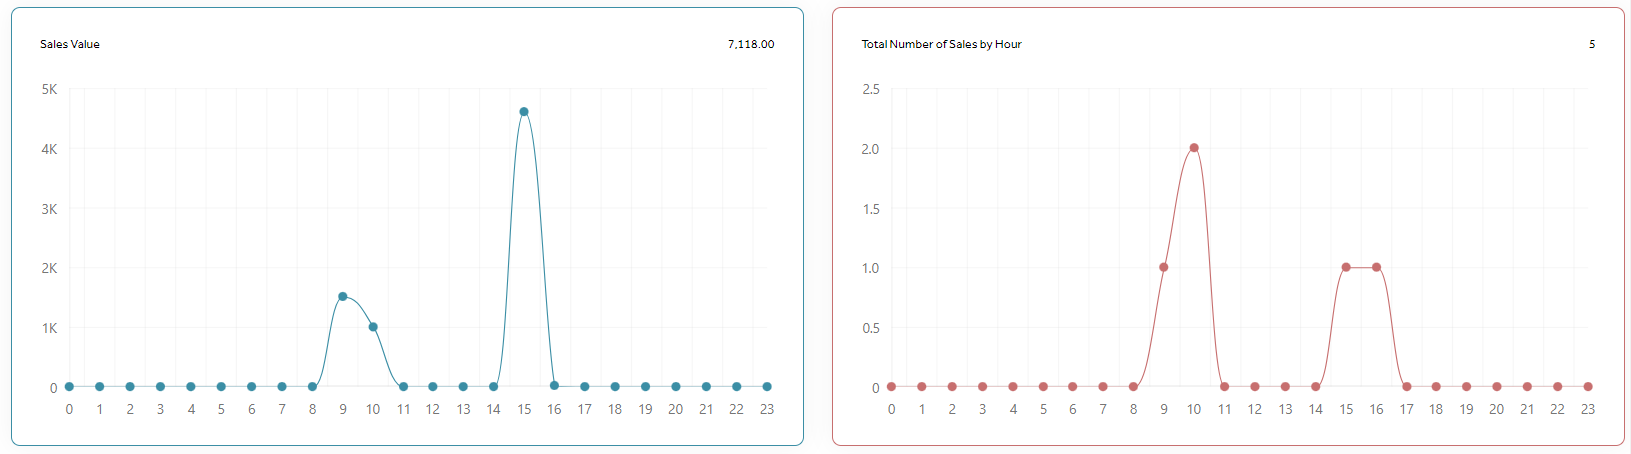
Total Revenue by Hour Excluding Vat.
Total Number of Sales by Hour.
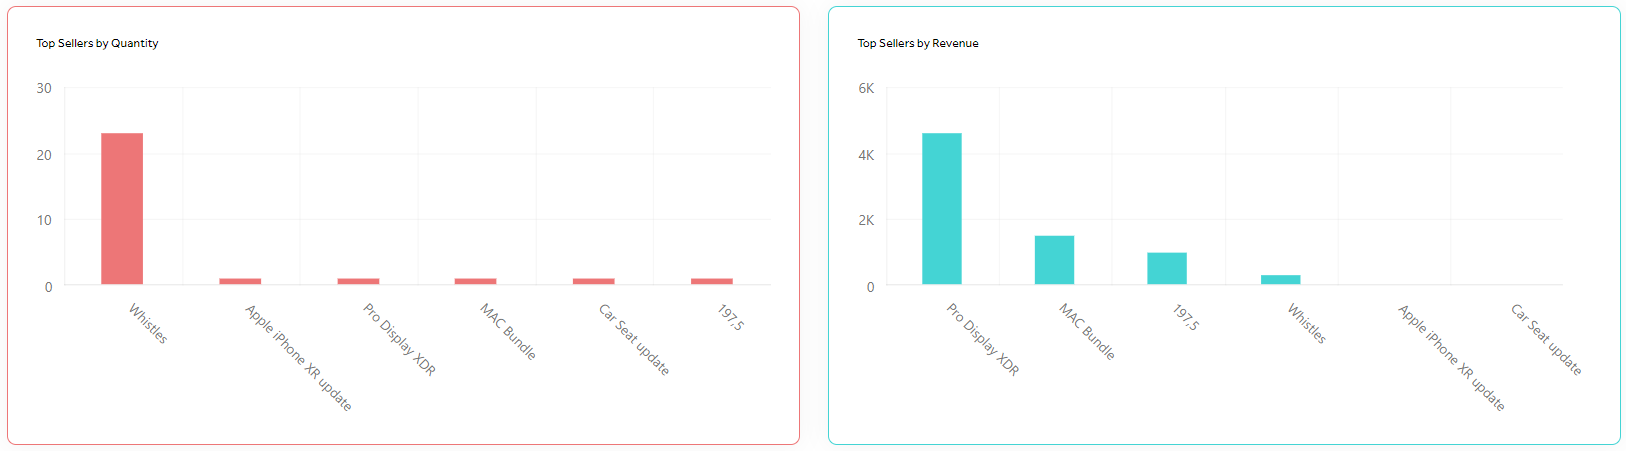
Top Sellers by Revenue.
Top Sellers by Quantity.
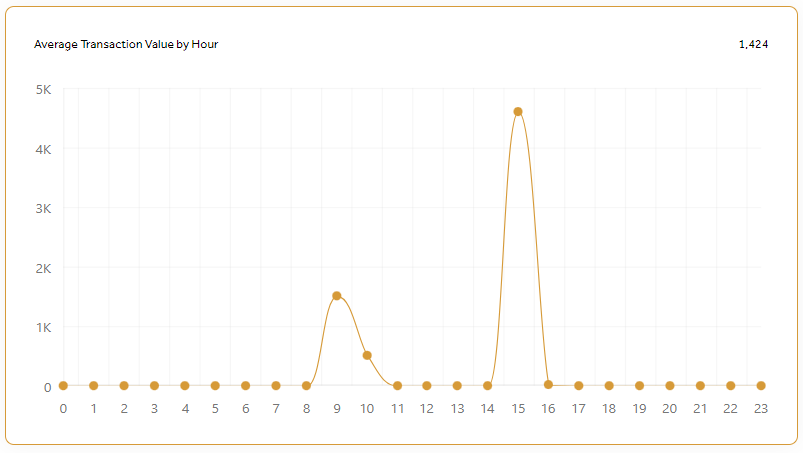
Average Transaction Value by Hour.
Top right of some graphs is a corresponding summary value.
NOTE: There is no print option for the Dashboard reports.