Sales Dashboard
The Dashboard has been broken down into 3 sections to explain what each area is used for.
- Data Filters
- Key Performance Figures
- Data Performance Table
Data Filters
![]() If a field is left blank this will automatically choose all options available.
If a field is left blank this will automatically choose all options available.
![]() The search will only return up to 10000 lines of data. If your search exceeds the limit a notification will display.
The search will only return up to 10000 lines of data. If your search exceeds the limit a notification will display.

|
From Date |
Pick a Start Date. |
|
To Date |
Pick an end Date. |
|
Shops |
Choose from your set list of shops. |
|
Vendor |
Select specific or all vendors available. |
|
Shop Group |
Choose a group of selected shops. |
|
Company |
This can be used if a Tenant has multiple companies within Imagine. |
|
Hierarchy |
This is to narrow down a category as required by only one level. NOTE: You can narrow down Hierarchy Levels further by using the Column Chooser. |
|
Clerks |
Use to narrow down to a specific Clerk member or all Clerks available. |
|
Customer |
Select a specific customer or a collection of specific customers. |
|
Type |
Choose between Sale or Return |
|
Receipt |
Use the saved receipt number to narrow down to a particular sale/return. NOTE: Using the Receipt Number will override all other fields. |
|
Group by Columns |
Group by Columns - This is used when grouping column Headers. For more information see Grouping Categories. NOTE: If you press submit without selecting a number of columns you will receive a warning. |
![]() This will fetch the data *if available.
This will fetch the data *if available.
![]() Saves Report's, this will also save the format you have configured.
Saves Report's, this will also save the format you have configured.
![]() To review past saved reports.
To review past saved reports.
Key Performance Figures
These are static boxes of overall information from the data shown in the Data Performance Table.

|
Sales |
This is an overall figure for sales within the table. |
|
Sales Ex Tax |
This is an overall figure for Sales Excluding Tax. |
|
Tax |
Total Tax figure from the data in the table. |
|
Qty |
Overall Quantity of items generated within the data. |
|
Cost |
Overall costing of outgoings that are not sales through the till. i.e postage. |
|
Discount |
Overall discount applied across all sales. |
|
Profit |
Overall Profit figure. |
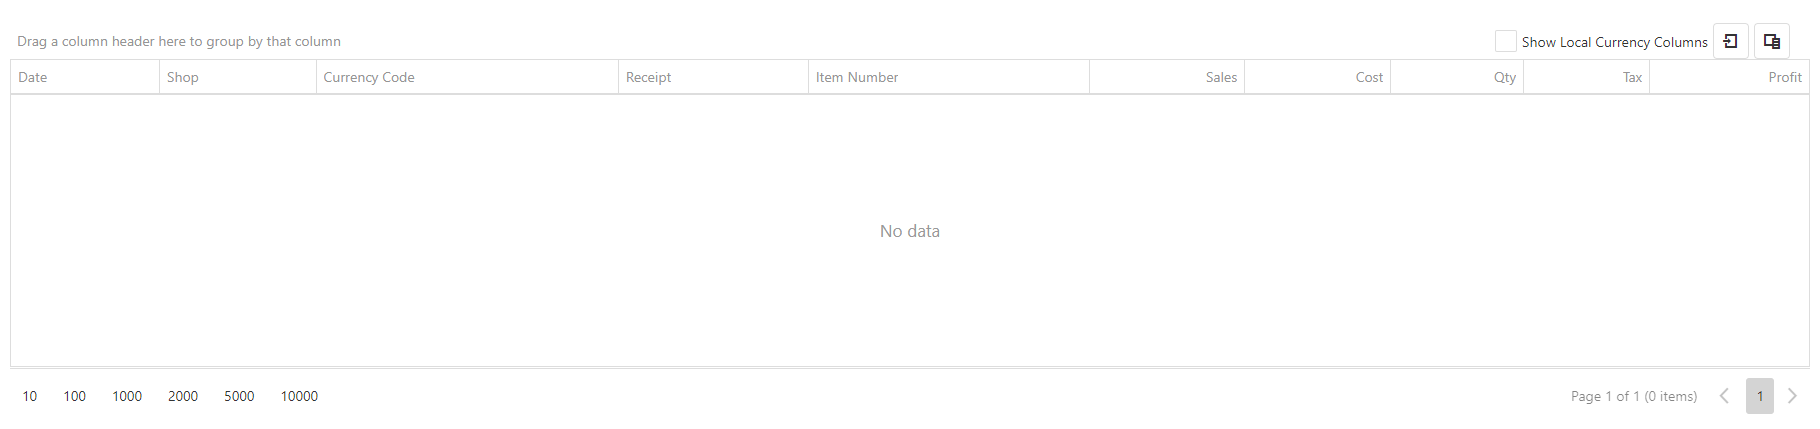
Data Performance Table
The table shows the data of which information you have selected from the fields above, you can modify the way the information is displayed.
![]() Column Chooser - This will bring up a list of options to add or remove columns.
Column Chooser - This will bring up a list of options to add or remove columns.
![]() Export All Data - This will export the data to an .xlxs file for use. There is no option to print directly from this page.
Export All Data - This will export the data to an .xlxs file for use. There is no option to print directly from this page.