Items Dashboard
The Dashboard has been broken down into 3 sections to explain what each area is used for.
- Item Data Filters
- Key Performance Figures
- Item Data Performance Table
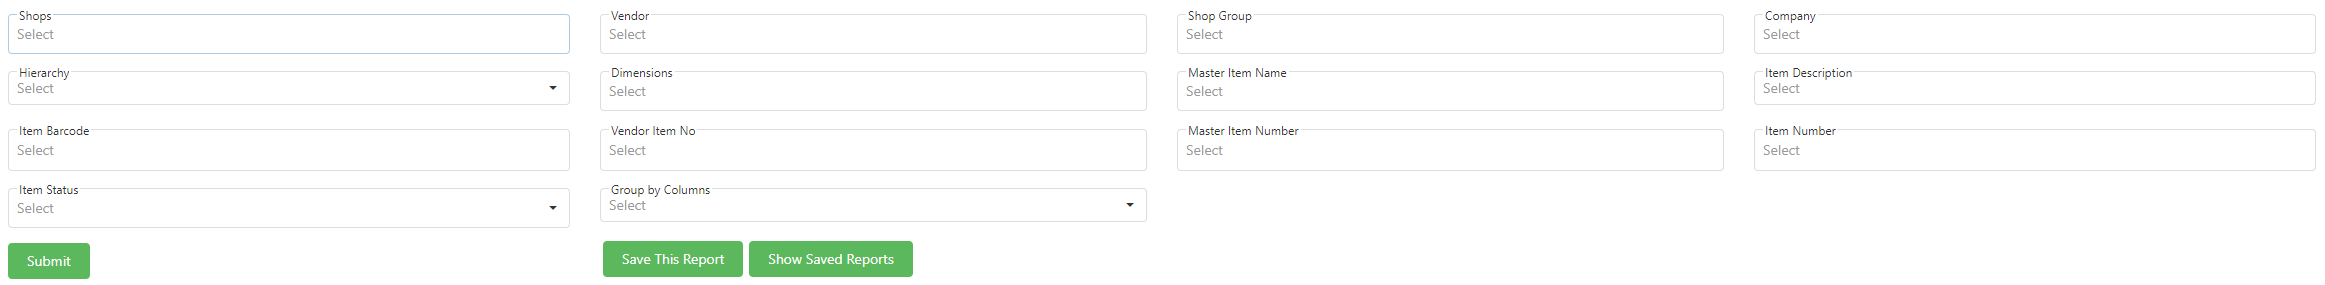
Item Data Filters
![]() If a field is left blank this will automatically choose all options available.
If a field is left blank this will automatically choose all options available.
![]() The search will only return up to 10000 lines of data. If your search exceeds the limit a notification will display.
The search will only return up to 10000 lines of data. If your search exceeds the limit a notification will display.
|
Shops |
Choose from your set list of shops. |
|
Vendor |
Select specific or all vendors available. |
|
Shop Group |
Choose a group of selected shops |
|
Company |
This can be used if a Tenant has multiple companies within Imagine. |
|
Hierarchy |
This is to narrow down a category as required by only one level. NOTE: You can narrow down Hierarchy Levels further by using the Column Chooser. |
|
Dimensions |
Here you can input particular Dimensions of a product that were given at Item Creation. |
|
Master Item Name |
This is the Name given to the Item at creation. |
|
Item Description |
This can be used to narrow down descriptive information about a product such as Material type, weight, size, artist information, design notes etc. |
|
Item Barcode |
This is used to as the item identifier when purchased or scanned. |
|
Vendor Item Number |
The Vendor number or code by which the master item is known or referenced by. |
|
Master Item Number |
This is the number or code by which the master item is known or referenced by. |
|
Item Number |
This is the number or code by which the master item is known or referenced by. |
|
Item Status |
Select between if an item is Active or Inactive. |
|
Group by Columns |
Group by Columns - This is used when grouping column Headers. For more information see Grouping Categories. NOTE: If you press submit without selecting a number of columns you will receive a warning. |
![]() This will fetch the data *if available.
This will fetch the data *if available.
![]() Saves Report's, this will also save the format you have configured.
Saves Report's, this will also save the format you have configured.
![]() To review past saved reports.
To review past saved reports.
Key Performance Figures
These are static boxes of overall information from the data shown in the Item Performance Table.

|
Qty On-hand |
This is the current quantity of items that you have in-store and available to sell. |
|
Val On-Hand |
This is the value amount of items. |
|
Qty On-Order |
This is how much you have on order or open POs. |
|
Val On-Order |
This is the monetary value amount of items on order calculated as the current shop weighted average cost * the current quantity on-order. |
|
Qty In-Transit |
This is the quantity of items stated as being shipped to in-store. |
|
Val In-Transit |
This is the monetary value amount of items being shipped to your store calculated as the current shop weighted average cost * the current quantity in-transit. |
|
Qty Off-Line |
This is the quantity of items marked as offline, that is items you have in-store but are not available to sell for a particular reason i.e. damaged or are unaccounted for. |
|
Val Off-Line |
This is the monetary value amount of items marked as offline calculated as the current shop weighted average cost * the current quantity off-line. |
Item Data Performance Table
The table shows the data results for the information you have selected using the fields above, you can modify the way the information is displayed.
![]() Column Chooser - This will bring up a list of options to add or remove columns.
Column Chooser - This will bring up a list of options to add or remove columns.
![]() Export All Data - This will export the data to an .xlxs file for use. There is no option to print directly from this page.
Export All Data - This will export the data to an .xlxs file for use. There is no option to print directly from this page.
