Financial Summary
The Financial Summary report provides more detail on how the company is performing from a Financial data point of view.
From the Date Picker and Shop Selection filter you can break the report down to specific periods of time and by individual shop.
NOTE: There is no print option for the Dashboard reports.
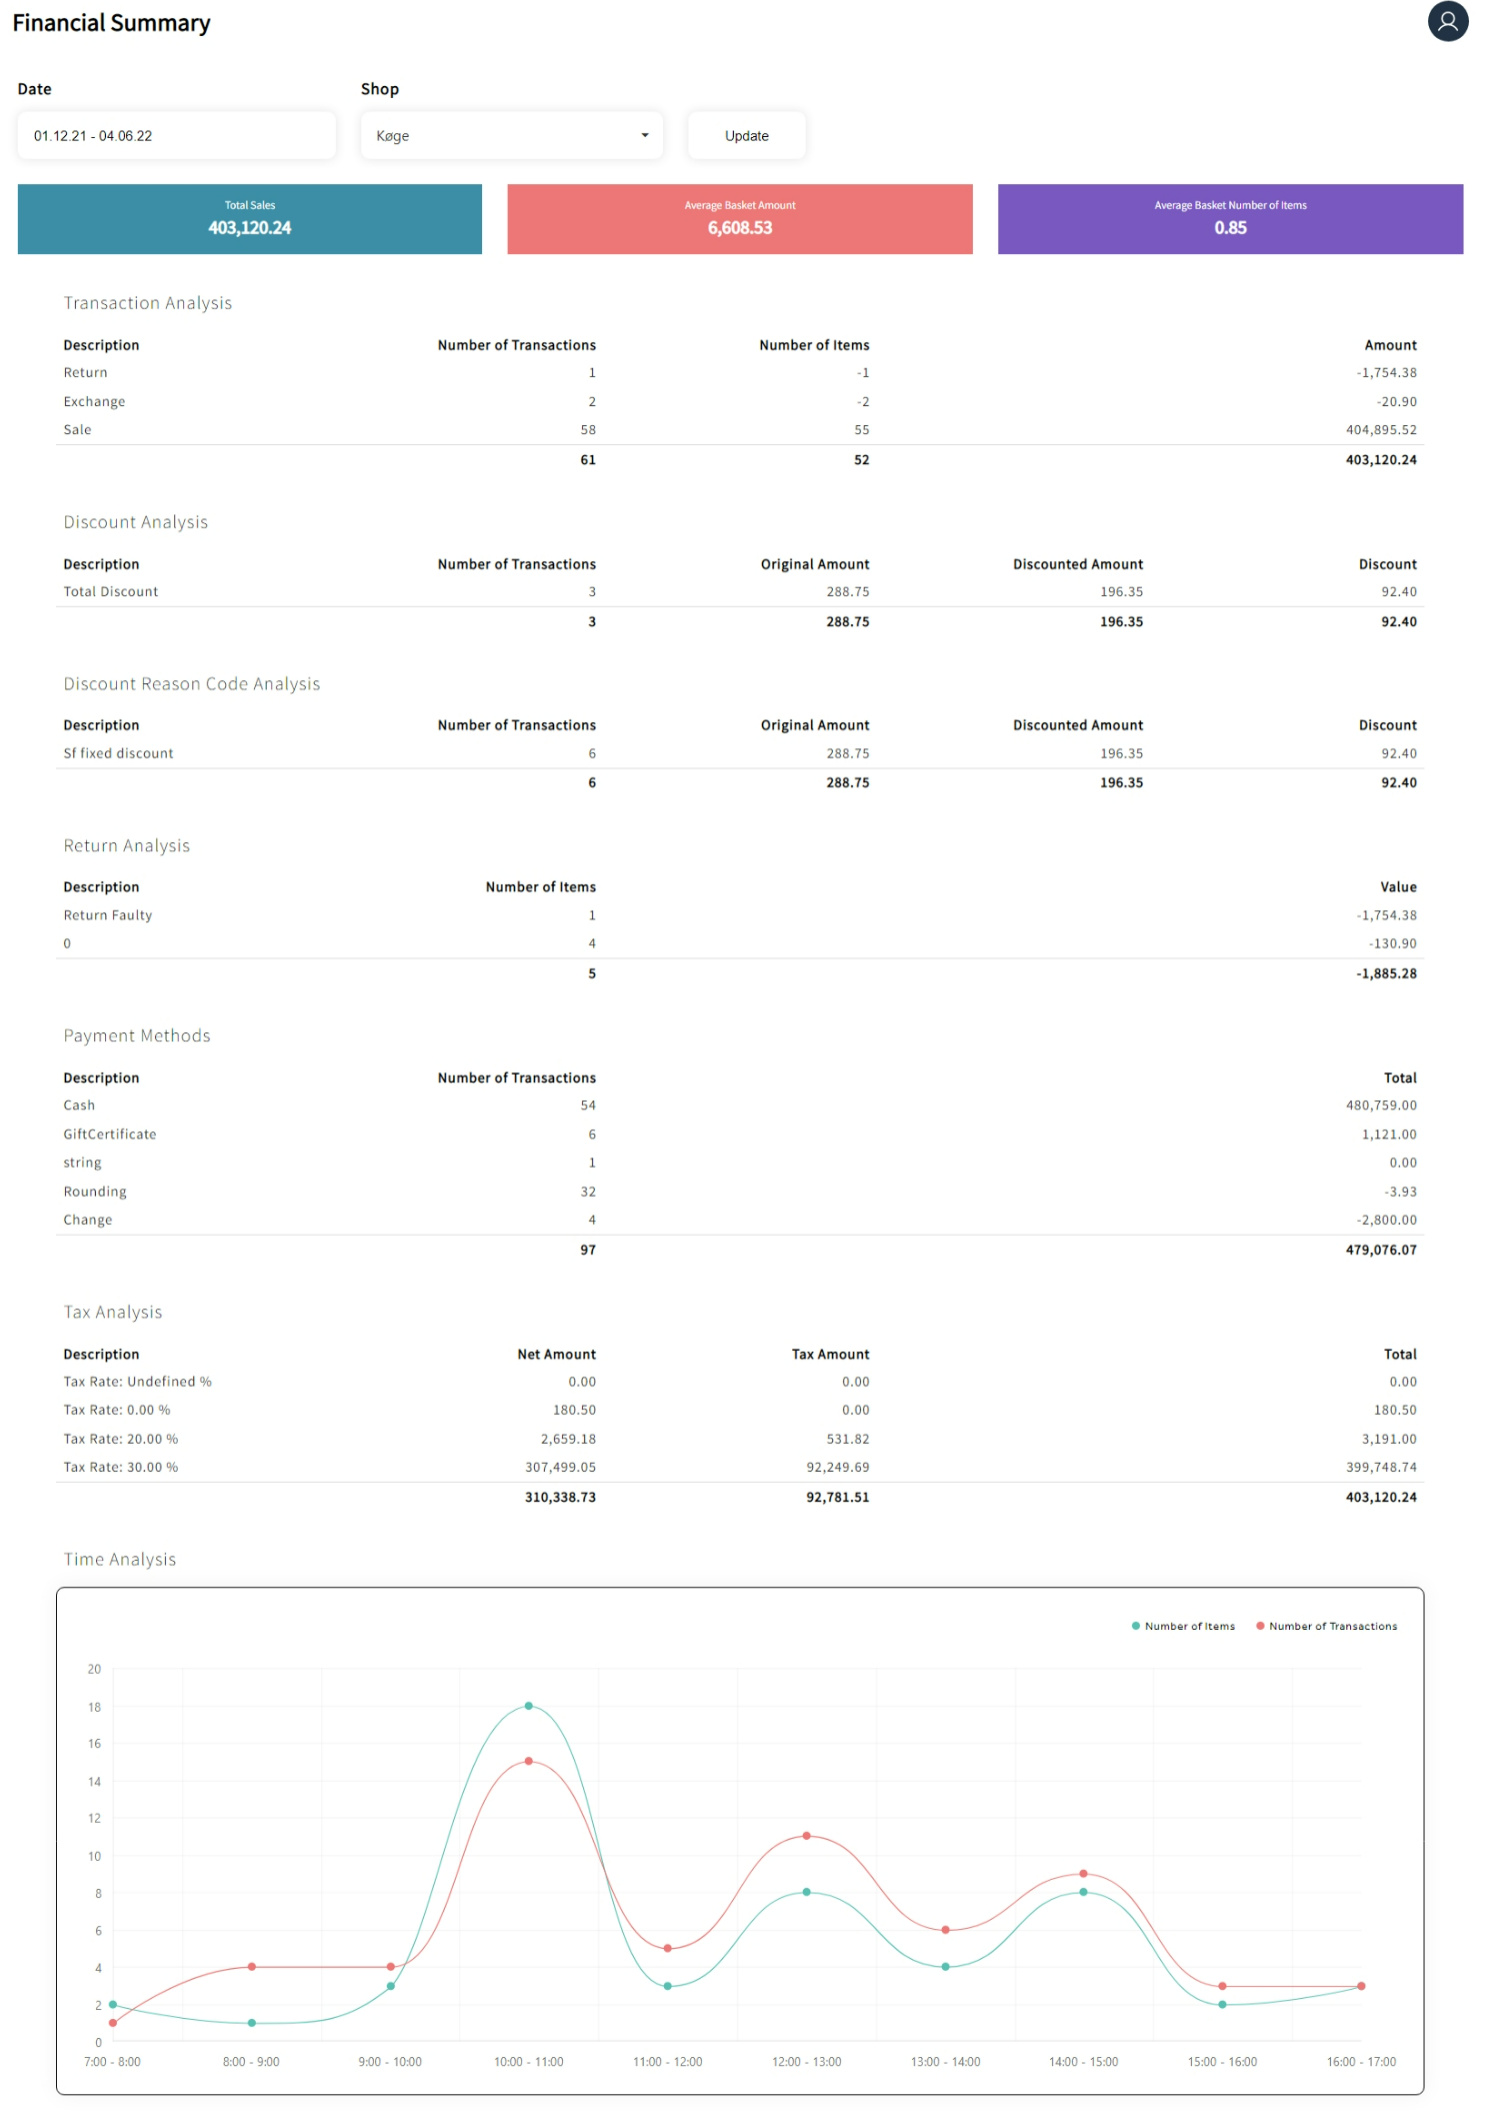
Key Performance Figures
- Total Sales
- Average Basket Amount
- Average Basket Number of Items
![]()
Financial Data Summary: List of Report Fields
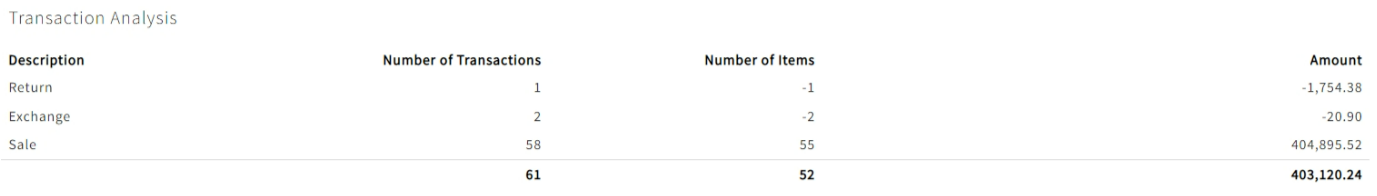
- Transaction Analysis
- Description
- Number of Transactions
- Number of items
- Amount.
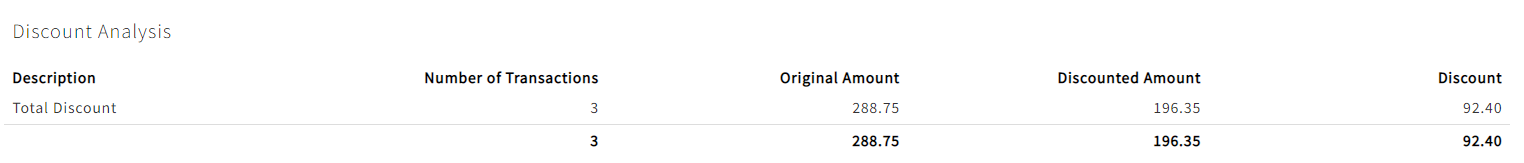
- Discount Analysis
- Description
- Number of Transactions
- Original Amount
- Discounted Amount
- Discount
- Discount Reason Code Analysis
- Description
- Number of Transactions
- Original Amount
- Discounted Amount
- Discount

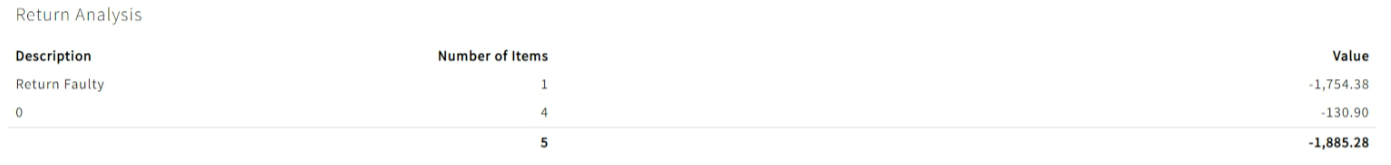
- Return Analysis
- Description
- Number of items
- Value
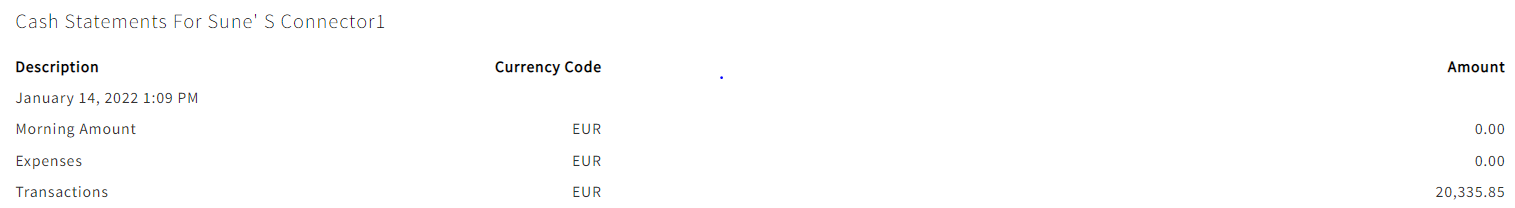
- Cash Statement for Connector
- Description
- Currency Code
- Amount
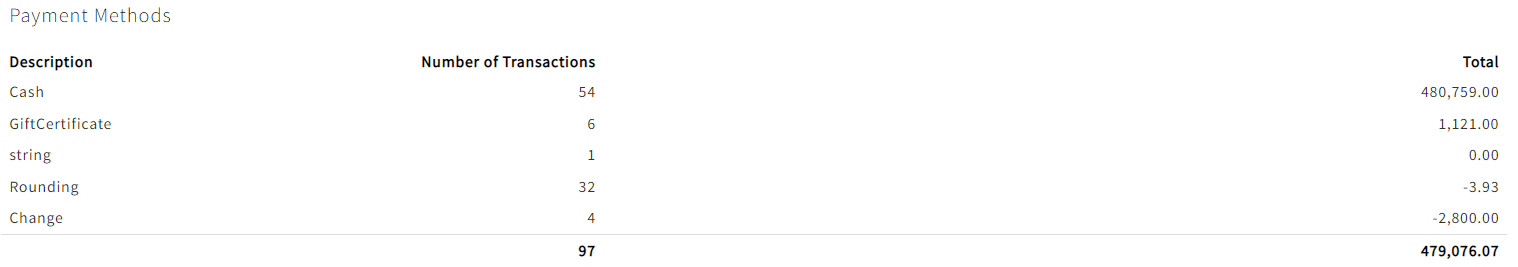
- Payment Methods
- Description
- Number of Transactions
- Total
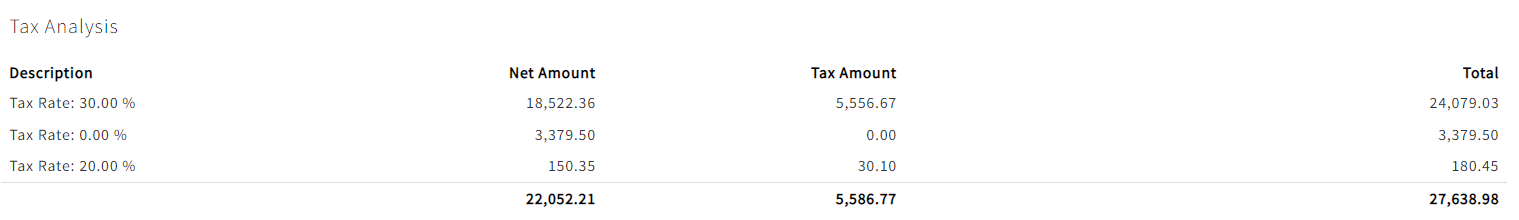
- Tax Analysis
- Description
- Net Amount
- Tax Amount
- Total
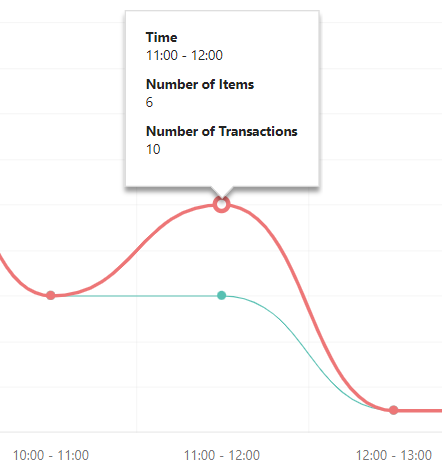
Time Analysis Graph
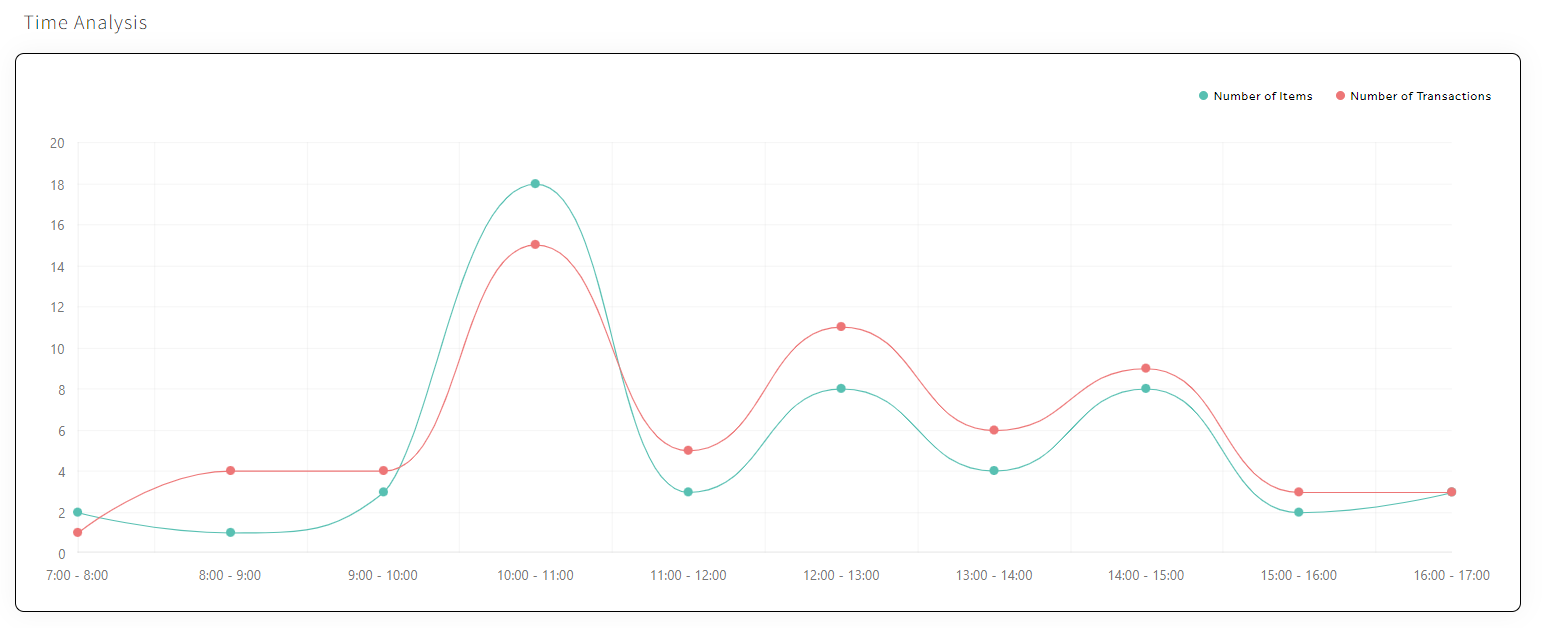
Additional Financial data is shown on the Time Analysis graph if you hover the pointer / mouse over the data points.