Financial Stock
Financial stock allows you to see stock, purchase and correction figures whilst also being able to apply a filter and group the results.
Filter
To add a filter select the  button:
*Note when using the autocomplete any option shown as a pill below the value input field will always be treated as an include to the report and does not abide by the selected operator, this will only apply to
the text in the Value field: 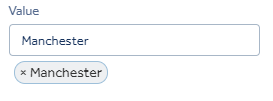
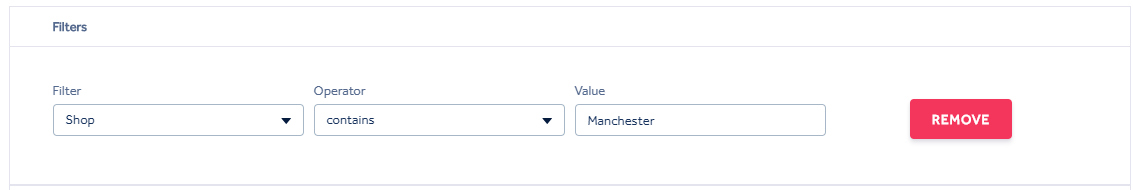
The filter option allows for a filter based upon:
- Shop
- Master Items
- Vendor
Once the filter drop down option has been selected an operator can be chosen from the following:
- contains
Finally a constraint can be added. The example above will exclude the shop named Manchester.
Multiple filters can be added by choosing the button. To remove an applied filter press the  button.
Group By
The Group By toggles can be used to group the filter results. A maximum of 4 Groups can be selected. The Group hierarchy is determined by the level in which the groups are set, you can change the group order by clicking and dragging on the group handle  .
.
In the example below the Report will be group by Shop then By Master Item:
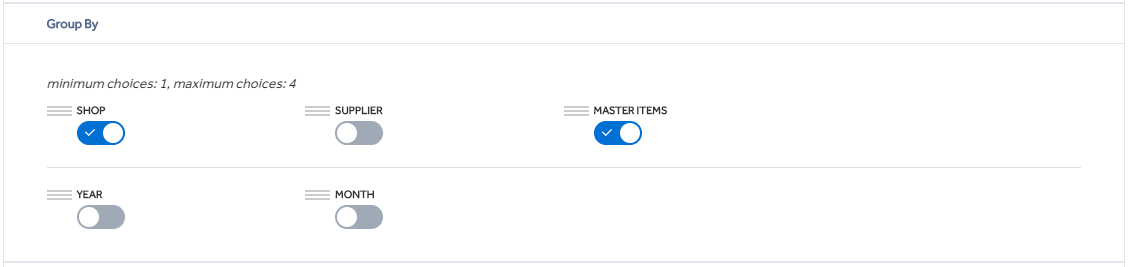
Note the dimensions grouping will only display if you have configured Dimension types from within Item Management.
Date Range
The report will display the results from the date range selected, you must enter a start and end date range within a 10 year period. The filter defaults to a month back from the current date to the current date.
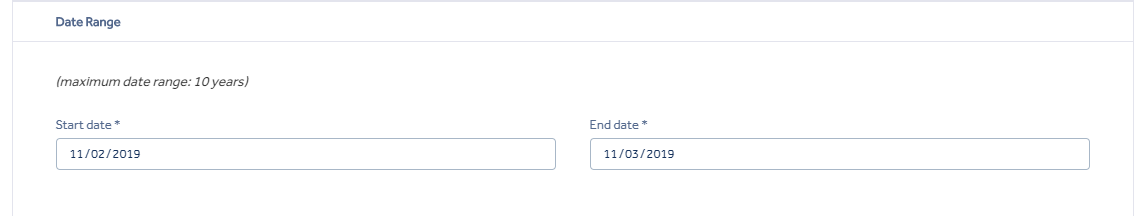
By clicking on the  within the Start or End date a calendar will be shown where the date can be selected.
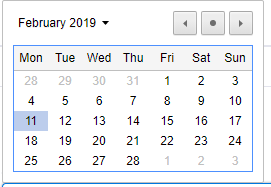
Within the calendar selecting the  will choose todays date.
Generate
Once the filter, grouping and date range has been selected clicking Generate will display the report in 2 sections.
Report Grid
The first section is the report grid.
The below example shows a report grouped by Shop and Master Item.
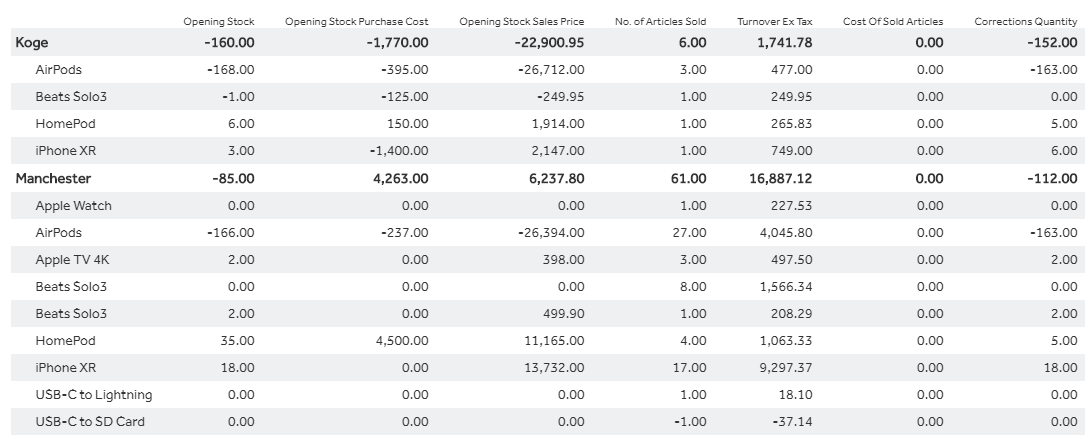
The report grid headings display the following data:
- Opening Stock - The stock quantity as of the report dare
- Opening Stock Purchase Cost - The purchase cost of the opening stock
- Opening Stock Sales Price - The retail value of the opening stock
- No. of Articles Sold - The number of articles sold during the date period specified
- Turnover Ex Tax
- Cost of Sold Articles - The purchase cost of articles sold
- Corrections Quantity - The quantity of items with stock adjustments
- Corrections Cost - The cost * the number of items adjusted
- Purchase Quantity - The number of items purchase from the specified date range
- Purchase - The cost of items purchased
- Transfer - The quantity of items transferred
- Transfer Cost - The cost of items transferred
- EOP Stock - Stock as of the end date
- EOP Stock Purchase Cost - Cost price of the stock as of the end date
Clicking 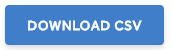 will download a csv file of the report grid
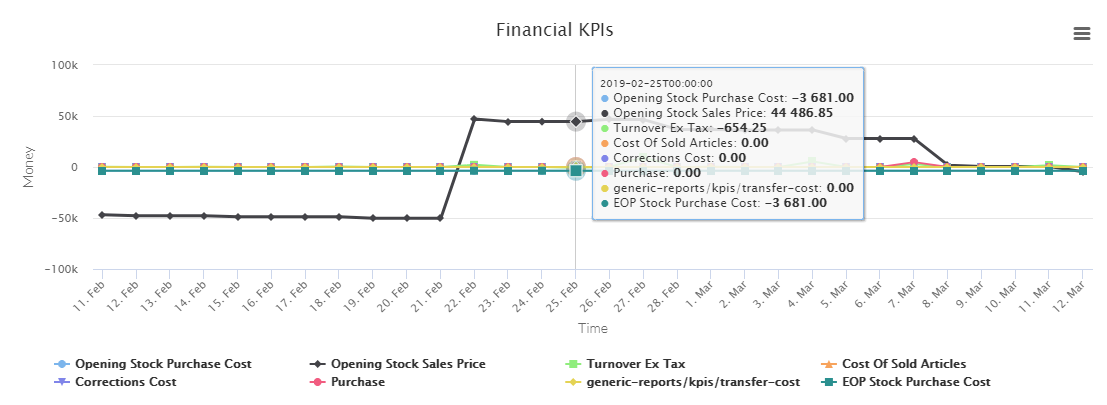
Graphs
The second section shows the KPI graphs. The top graph is the financial KPI, hovering over any of the lines will display the chart figures.
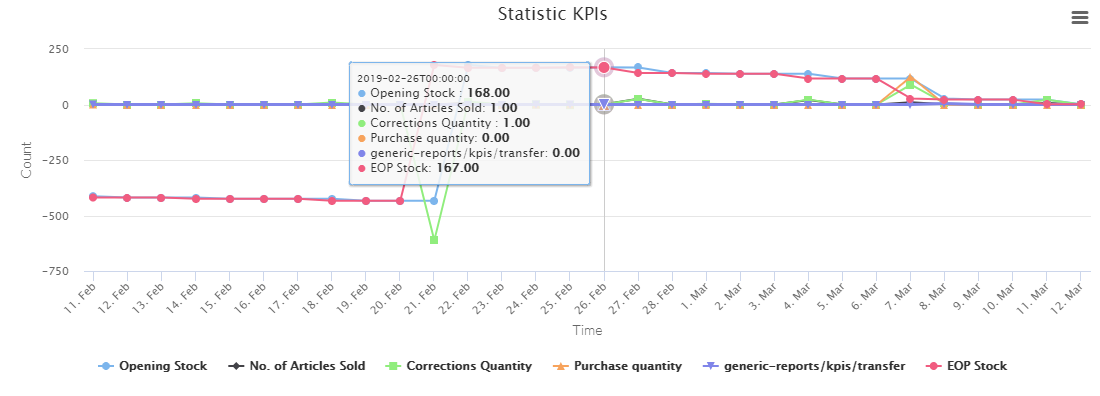
The bottom graph is the financial KPI, hovering over any of the lines will display the chart figures.
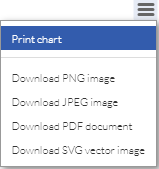
Selecting the hamburger icon allows you to print or download the charts in various formats.